
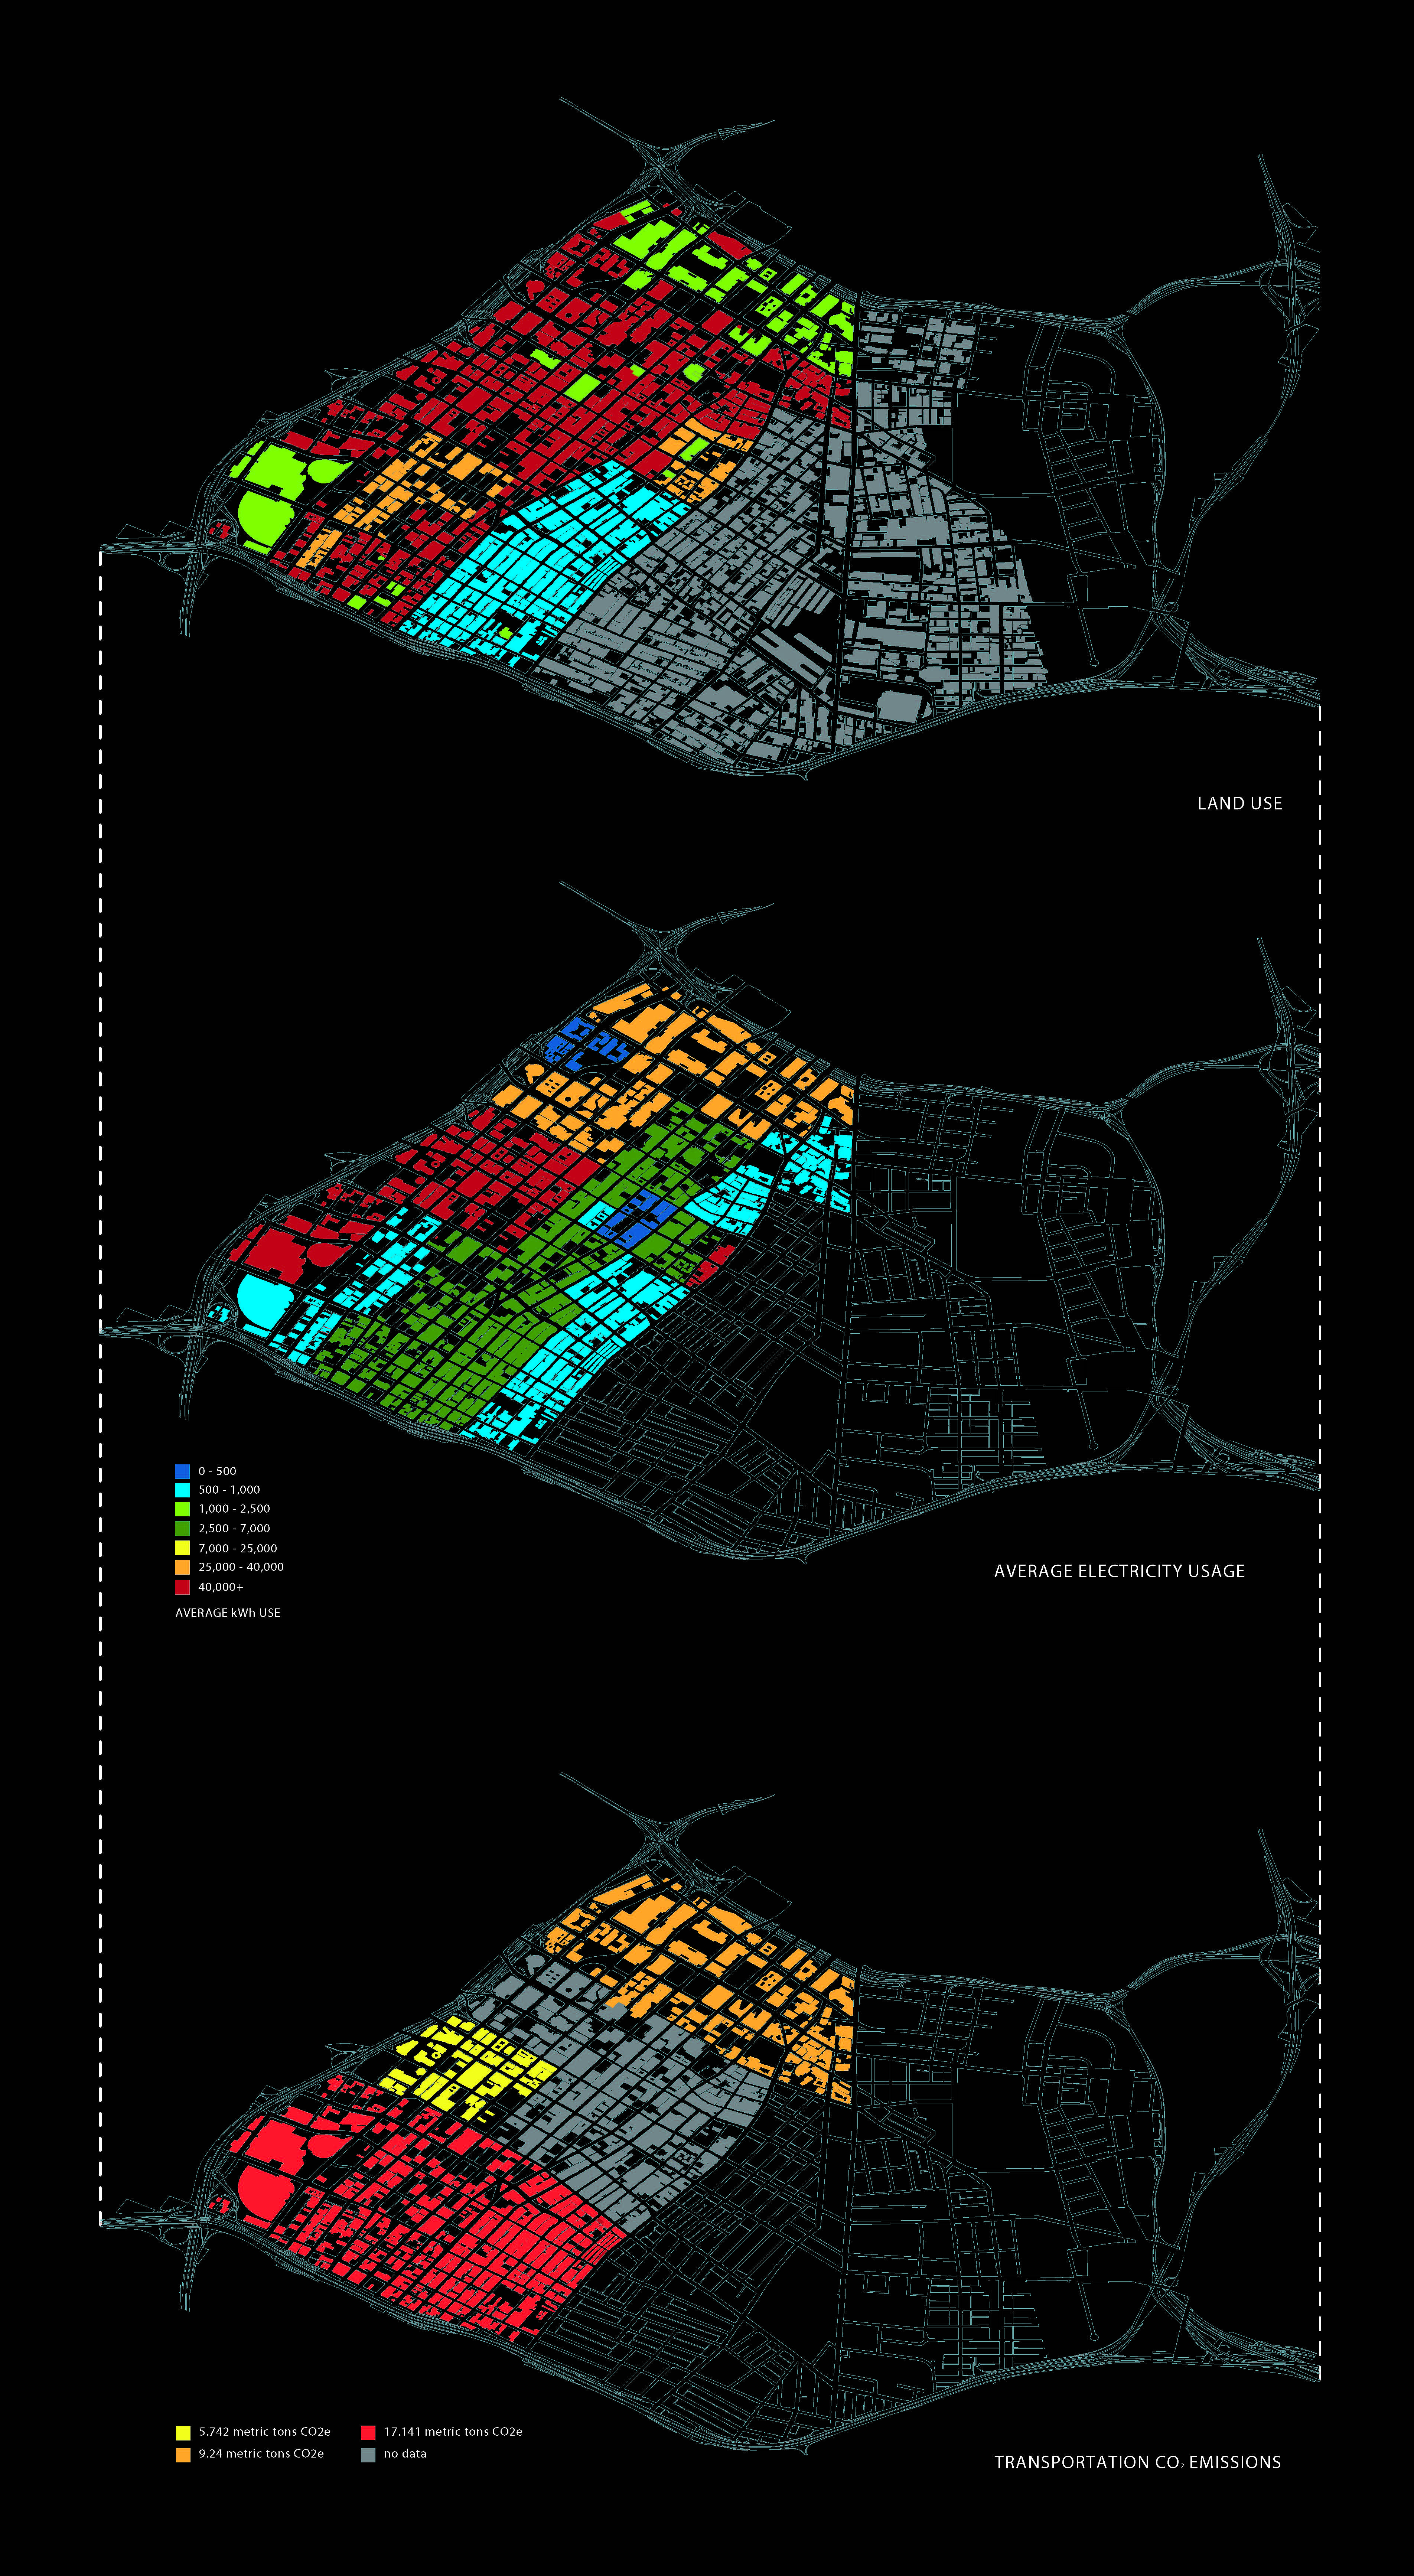
A diagram that represents the current emissions going on in the 2030 District. These diagrams sum up commercial, residential, and industry electricity usage as well as CO2 emissions.
A diagram that represents the current emissions going on in the 2030 District. These diagrams sum up commercial, residential, and industry electricity usage as well as CO2 emissions.
